
I have been debating whether I should post this article for a while now. Some of you may be a bit uneasy or worried about things you see on the news related to politics & the stock market, and I want to take this opportunity to help put your mind at ease.
Part of me wants to keep you all trained on keeping a long-term perspective with your investment strategy, as I know that the data is clear on the power of staying invested through times of panic. As someone who follows the markets closely, it would be easy for me to tell you to “just block out all the noise”, but the truth is, we are all human.
I originally wanted to avoid giving you any sort of commentary on what’s happening in the market to keep your mind away from short-term performance. The only thing we can do is look at the historical data, keep a long-term perspective, and make the smartest decisions possible. This is the very essence of what a financial advisor does.
On the other hand, I do not think it is fair to leave people in the dark if you are feeling panic right now, which is 100% normal. There is a lot happening at a fast pace. Every day, it seems like a new media headline comes out. I want to give you a breakdown of what is happening with the market right now, as well as share with you what has happened in the past so that you have a clearer picture of the situation.
*There are a few charts here. I know these things can be confusing – I will do my absolute best to summarize the information simply, so don’t even have look at them if they annoy you.
First, I want to go over what I’m talking about when I refer to the market. The “market” commonly refers to something called the S&P 500. The S&P 500 is made up of five hundred of the largest companies in the US. It has a measured value based on how well the stocks of all those companies are doing, taking a sort of average of them all. All the big names like Apple, Microsoft, Google, Walmart, and Ford are included in this. It was made so that we can track the general performance of all large companies in the US to see how the economy is doing. We can also invest directly in the S&P 500 to get access to a bunch of companies with one simple fund. Many of you have this in your portfolio (called SPLG).
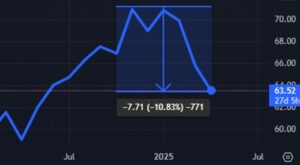
This first chart above shows the value of the S&P 500 over the past couple of months. From its peak, we see that it’s down a little over 10%. Tarriff announcements by the new administration have been the main cause of this decline. Hopefully, this is not the only thing in your portfolio.
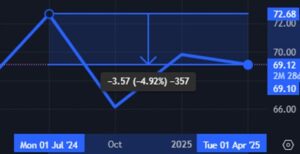
The above chart tracks a similar number, but instead of US companies, it measures how stocks in foreign countries are performing. We see that the decline has been much more gradual, only around 5% from the peak in July, and it has barely dropped at all since inauguration. Many of you have a chunk of your portfolio invested in this as well (called IXUS, IEFA, SCHF or VEA) which has protected us from bigger losses in US stocks.
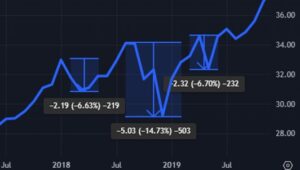
If you were following things during Trump’s first term, you will know that a similar tariff strategy was enacted back in Jan 2018 and extended all the way into the middle of 2019. Throughout that cycle of shifting tariffs on China, Canada, Mexico, and the EU amongst other countries, we saw multiple drawdowns in the stock market as shown in the chart above. We saw a ~7% dip, a ~15% dip, and a ~7% dip during this time. Dips are very common in the stock market, and we shouldn’t be panicked by the 10% drawdown we are in now. We could be following a very similar path as 2018 right now, but I think it’s very important to zoom out and see what happened after.
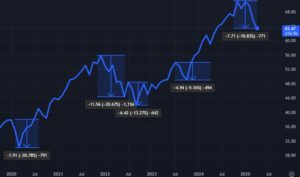
After experiencing a near 21% drop in 2020 during the Covid-19 pandemic, we have seen incredible strength in the market, which has more then doubled since the bottom in 2020. This chart shows the S&P 500 from 2020 to now, showing the 4 drawdowns comparable or greater to what we are seeing today. The media may tell you that the stock market is crashing worse than ever, but we can clearly see that comparable drops have happened multiple times in the past few years. The media loves panic – it sells (aren’t they always calling for a recession?
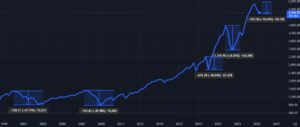
If we zoom out and look at the market doing back to 2000, you will see that we have recovered from some massive drawdowns:
- 48% from 2000-2002 during the Dotcom bubble
- 50% during the Great Financial Crisis/housing crash of 2008
- 21% during the Covid-19 pandemic
- 26% during the inflation surge 2021-2022
You can see that after every crisis, the stock market has recovered over the long-term. For someone who may have needs for their money in the shorter term, this is why we mix in conservative investments like bonds, cash, and money market funds so that we can ride out these crashes. From 2000 to today, the S&P 500 has provided total of return of around 500%. This will hopefully help you to see that what is happening today is rather insignificant in the grand scheme of things.
My clients can sleep comfortably knowing I’ve custom-built each of their portfolios to withstand what happens based on their needs. A solid long-term plan will always beat market timing, the research is crystal clear. As Warren Buffet says, “Predicting rain doesn’t count. Building arks does.”
I am always happy to discuss any of your concerns. My phone, email, and office are always open.

– Clint Kraft
Founder and Financial Advisor, Kraft Capital